Room Acoustics
Preparing Plans for Acoustic Calculation |
By importing acoustic maps, you can display various room acoustic sizes, such as sound pressure level, reverberation time, and speech intelligibility, for individual plans. This map – also known as an acoustic grid or voxel grid – takes the acoustic effects of the room and furnishings into account as well as the position of sound sources and absorbers. The acoustic values are calculated externally and imported into the corresponding project in pCon.planner.
Preparing Plans for Acoustic Calculation
First, create your plan as usual and include all required furnishing. To calculate acoustic parameters, all rooms must be closed.
If necessary, you can indicate sound sources and sound receivers within the plan. To do so, create an object of your choice (i.e. a drawing element) and assign the layer as ACOUSTICS_SOURCE or ACOUSTICS_RECEIVER.
Note: You can see all the acoustic layers in your design in the Layer dialog. The acoustic layers are switched to invisible as long as you do not use the Acoustics plugin. If the Acoustics plugin is activated, the acoustic layers are displayed in the Layer dialog by default. If you want to hide or show your acoustic layers as well as the objects on them, please open the context menu in the Layer dialog and uncheck/check Show Acoustics Layers. |
|---|
Obtaining Acoustic Calculations
Save the plan as usual. The acoustic parameters are calculated by our acoustic partners at Schall&Raum.
Inserting Acoustic Visualization into the Plan
You will receive a file in CNIVG format from our acoustic partner. This file will include the appropriate acoustic map, also known as a voxel grid, which will display acoustic values through pseudocolor zones. To use them, proceed as follows:
1.Open the output plan.
2.In the Application Menu, click on Import.
3.Choose the appropriate CNIVG file from your file system and click Open.
4.pCon.planner will insert the grid congruently with your floor plan.
Visualizing Acoustics in the Plan
The acoustic grid will be displayed in both the planning and Layout areas. Settings can be changed for both. The newest settings will be applied to both areas.
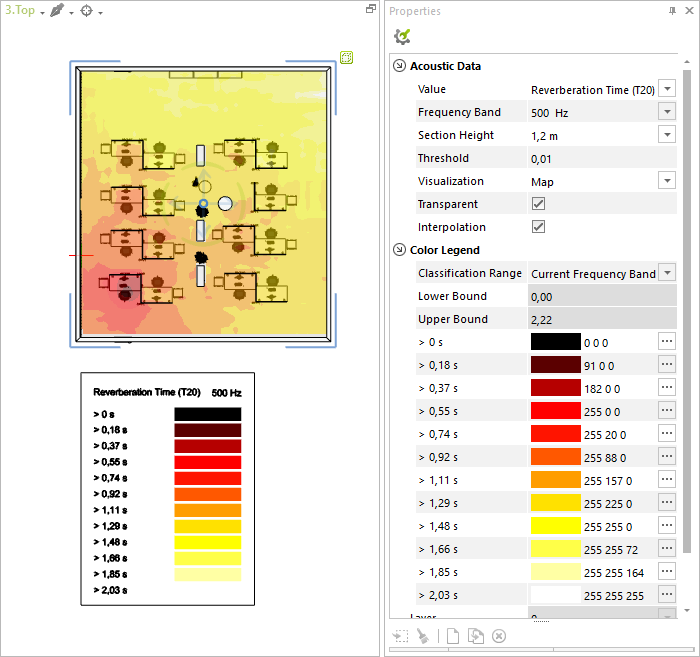
The color key indicates which values are heard within the acoustic map’s particular color zones. The key can be inserted as follows:
1.Select the voxel grid.
2.Right click to open the Context Menu.
3.Click Create Color Legend.
You can then place the key in the desired location. The key always indicates the current Acoustic Settings. This function is also available in the layout area.
Modifying the Acoustic Grid - Settings
Select the acoustic grid in the Properties Editor to change the acoustic display. The Size is the most important setting, as this determines which acoustic parameters are shown within the display of the acoustic grid. The following table includes all acoustic grid settings.
Option |
Function |
Value: Sound Level |
Describes the noise exposure in decibels at each point of the room. |
Value: A-weighted Sound Level |
Describes the noise exposure in decibels at each point of the room in frequency adjustment to human hearing. |
Value: Reverberation Time T20 |
Describes the time interval within which the sound pressure of a room drops down to a fraction of the initial value after silencing the sound source. |
Value: STI |
The speech transmission index describes the intelligibility of language at a particular point within the plan. |
Frequency Band |
Examination of the acoustic parameters for a specified frequency band. |
Section Height |
Cross section through the voxel grid at a specified height: A selected sectional plane is displayed using the acoustic reality of the room. |
Threshold |
Only values above the threshold are displayed (i.e. quieter noises are faded out). Only values between the lower and upper threshold can be used as the threshold value. |
Visualization: Map/Points |
Display pseudocolors as a “map” or grid made of points.
Note: Displaying the acoustic grid as a Map is possible in all render styles. The Point visualization is recommended for the render styles Wireframe, Shaded and Realistic. |
Transparent |
Transparent display; for Map display. |
Interpolation |
Interpolation of the acoustic parameters for smoothing out the pseudocolor map. |
Classification Range |
Subdivision of the depicted area. Depending on the basic size, various options are available to divide a range into classes based on its upper and lower barriers. Alternatively, you can define an individual area. |
Lower Bound |
Lower range limits in which values are divided into classes. A value is suggested depending on basic size and class division. |
Upper Bound |
Upper range limits in which values are divided into classes. A value is suggested depending on basic size and class division. |
Color Values per Range |
pCon.planner suggests color values per range, which are displayed in the pseudocolor map and in the color key. You can manually change the colors. |